others-How to show or print nginx threads size or any linux process's thread size?
1. Purpose
In this post, I would demonstrate how to print ngix threads size or print any linux process’s thread pool size.
2. The solution
2.1 What is a thread in linux?
To Linux, threads are simply a manner of sharing resources between processes (which are already quite lightweight)11. For example, assume you have a process that consists of four threads. On systems with explicit thread support, there might exist one process descriptor that in turn points to the four different threads.
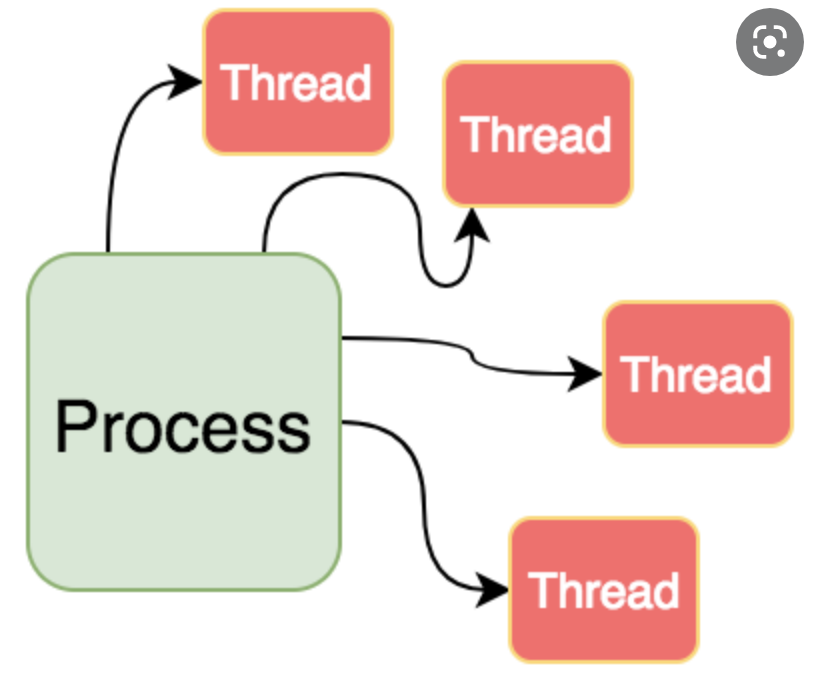
Threads in Linux are nothing but a flow of execution of the process. A process containing multiple execution flows is known as multi-threaded process. … Each thread is viewed by kernel as a separate process but these processes are somewhat different from other normal processes.
2.2 How to print or show the nginx thread size or any linux process’s thread count?
By default, nginx has one master process and some worker processes, how to know how many threads are there in the worker processes? Or more generally, how to know how many threads in linux processes?
Step #1: Check the PID of the process
Let’s say we want to print the thread count of nginx process:
root@launch-advisor-20191120:/etc/nginx/sites-enabled# ps -ef|grep nginx
root      7245  7063  0 14:55 pts/1    00:00:00 nginx -g daemon off; master_process off;
root      7409  7102  0 15:20 pts/0    00:00:00 grep --color=auto nginx
root@launch-advisor-20191120:/etc/nginx/sites-enabled#
So the PID of nginx process is 7245.
Step #2: Print the thread status of the process
Then we can print the process status of nginx:
root@launch-advisor-20191120:/etc/nginx/sites-enabled# cat /proc/7245/status|grep -i threads
Threads:	1
What is /proc directory in Linux system?
The /proc/ directory — also called the proc file system — contains a hierarchy of special files which represent the current state of the kernel — allowing applications and users to peer into the kernel’s view of the system.
Proc file system (procfs) is virtual file system created on fly when system boots and is dissolved at time of system shut down. It contains useful information about the processes that are currently running, it is regarded as control and information center for kernel.
What’s the meaning of /proc/
/proc/[pid]/stat
          Status information about the process.  This is used by ps(1).
          It is defined in the kernel source file fs/proc/array.c.

          The fields, in order, with their proper scanf(3) format speci‐
          fiers, are listed below.  Whether or not certain of these
          fields display valid information is governed by a ptrace
          access mode PTRACE_MODE_READ_FSCREDS | PTRACE_MODE_NOAUDIT
          check (refer to ptrace(2)).  If the check denies access, then
          the field value is displayed as 0.  The affected fields are
          indicated with the marking [PT].

          (1) pid  %d
                    The process ID.

          (2) comm  %s
                    The filename of the executable, in parentheses.
                    This is visible whether or not the executable is
                    swapped out.

          (3) state  %c
                    One of the following characters, indicating process
                    state:

                    R  Running

                    S  Sleeping in an interruptible wait

                    D  Waiting in uninterruptible disk sleep

                    Z  Zombie

                    T  Stopped (on a signal) or (before Linux 2.6.33)
                       trace stopped

                    t  Tracing stop (Linux 2.6.33 onward)

                    W  Paging (only before Linux 2.6.0)

                    X  Dead (from Linux 2.6.0 onward)

                    x  Dead (Linux 2.6.33 to 3.13 only)

                    K  Wakekill (Linux 2.6.33 to 3.13 only)

                    W  Waking (Linux 2.6.33 to 3.13 only)

                    P  Parked (Linux 3.9 to 3.13 only)

          (4) ppid  %d
                    The PID of the parent of this process.

          (5) pgrp  %d
                    The process group ID of the process.

          (6) session  %d
                    The session ID of the process.

          (7) tty_nr  %d
                    The controlling terminal of the process.  (The minor
                    device number is contained in the combination of
                    bits 31 to 20 and 7 to 0; the major device number is
                    in bits 15 to 8.)

          (8) tpgid  %d
                    The ID of the foreground process group of the con‐
                    trolling terminal of the process.

          (9) flags  %u
                    The kernel flags word of the process.  For bit mean‐
                    ings, see the PF_* defines in the Linux kernel
                    source file include/linux/sched.h.  Details depend
                    on the kernel version.

                    The format for this field was %lu before Linux 2.6.

          (10) minflt  %lu
                    The number of minor faults the process has made
                    which have not required loading a memory page from
                    disk.

          (11) cminflt  %lu
                    The number of minor faults that the process's
                    waited-for children have made.

          (12) majflt  %lu
                    The number of major faults the process has made
                    which have required loading a memory page from disk.

          (13) cmajflt  %lu
                    The number of major faults that the process's
                    waited-for children have made.

          (14) utime  %lu
                    Amount of time that this process has been scheduled
                    in user mode, measured in clock ticks (divide by
                    sysconf(_SC_CLK_TCK)).  This includes guest time,
                    guest_time (time spent running a virtual CPU, see
                    below), so that applications that are not aware of
                    the guest time field do not lose that time from
                    their calculations.

          (15) stime  %lu
                    Amount of time that this process has been scheduled
                    in kernel mode, measured in clock ticks (divide by
                    sysconf(_SC_CLK_TCK)).

          (16) cutime  %ld
                    Amount of time that this process's waited-for chil‐
                    dren have been scheduled in user mode, measured in
                    clock ticks (divide by sysconf(_SC_CLK_TCK)).  (See
                    also times(2).)  This includes guest time,
                    cguest_time (time spent running a virtual CPU, see
                    below).

          (17) cstime  %ld
                    Amount of time that this process's waited-for chil‐
                    dren have been scheduled in kernel mode, measured in
                    clock ticks (divide by sysconf(_SC_CLK_TCK)).

          (18) priority  %ld
                    (Explanation for Linux 2.6) For processes running a
                    real-time scheduling policy (policy below; see
                    sched_setscheduler(2)), this is the negated schedul‐
                    ing priority, minus one; that is, a number in the
                    range -2 to -100, corresponding to real-time priori‐
                    ties 1 to 99.  For processes running under a non-
                    real-time scheduling policy, this is the raw nice
                    value (setpriority(2)) as represented in the kernel.
                    The kernel stores nice values as numbers in the
                    range 0 (high) to 39 (low), corresponding to the
                    user-visible nice range of -20 to 19.

                    Before Linux 2.6, this was a scaled value based on
                    the scheduler weighting given to this process.

          (19) nice  %ld
                    The nice value (see setpriority(2)), a value in the
                    range 19 (low priority) to -20 (high priority).

          (20) num_threads  %ld
                    Number of threads in this process (since Linux 2.6).
                    Before kernel 2.6, this field was hard coded to 0 as
                    a placeholder for an earlier removed field.

          (21) itrealvalue  %ld
                    The time in jiffies before the next SIGALRM is sent
                    to the process due to an interval timer.  Since ker‐
                    nel 2.6.17, this field is no longer maintained, and
                    is hard coded as 0.

          (22) starttime  %llu
                    The time the process started after system boot.  In
                    kernels before Linux 2.6, this value was expressed
                    in jiffies.  Since Linux 2.6, the value is expressed
                    in clock ticks (divide by sysconf(_SC_CLK_TCK)).

                    The format for this field was %lu before Linux 2.6.

          (23) vsize  %lu
                    Virtual memory size in bytes.

          (24) rss  %ld
                    Resident Set Size: number of pages the process has
                    in real memory.  This is just the pages which count
                    toward text, data, or stack space.  This does not
                    include pages which have not been demand-loaded in,
                    or which are swapped out.

          (25) rsslim  %lu
                    Current soft limit in bytes on the rss of the
                    process; see the description of RLIMIT_RSS in
                    getrlimit(2).

          (26) startcode  %lu  [PT]
                    The address above which program text can run.

          (27) endcode  %lu  [PT]
                    The address below which program text can run.

          (28) startstack  %lu  [PT]
                    The address of the start (i.e., bottom) of the
                    stack.

          (29) kstkesp  %lu  [PT]
                    The current value of ESP (stack pointer), as found
                    in the kernel stack page for the process.

          (30) kstkeip  %lu  [PT]
                    The current EIP (instruction pointer).

          (31) signal  %lu
                    The bitmap of pending signals, displayed as a deci‐
                    mal number.  Obsolete, because it does not provide
                    information on real-time signals; use
                    /proc/[pid]/status instead.

          (32) blocked  %lu
                    The bitmap of blocked signals, displayed as a deci‐
                    mal number.  Obsolete, because it does not provide
                    information on real-time signals; use
                    /proc/[pid]/status instead.

          (33) sigignore  %lu
                    The bitmap of ignored signals, displayed as a deci‐
                    mal number.  Obsolete, because it does not provide
                    information on real-time signals; use
                    /proc/[pid]/status instead.

          (34) sigcatch  %lu
                    The bitmap of caught signals, displayed as a decimal
                    number.  Obsolete, because it does not provide
                    information on real-time signals; use
                    /proc/[pid]/status instead.

          (35) wchan  %lu  [PT]
                    This is the "channel" in which the process is wait‐
                    ing.  It is the address of a location in the kernel
                    where the process is sleeping.  The corresponding
                    symbolic name can be found in /proc/[pid]/wchan.

          (36) nswap  %lu
                    Number of pages swapped (not maintained).

          (37) cnswap  %lu
                    Cumulative nswap for child processes (not main‐
                    tained).

          (38) exit_signal  %d  (since Linux 2.1.22)
                    Signal to be sent to parent when we die.

          (39) processor  %d  (since Linux 2.2.8)
                    CPU number last executed on.

          (40) rt_priority  %u  (since Linux 2.5.19)
                    Real-time scheduling priority, a number in the range
                    1 to 99 for processes scheduled under a real-time
                    policy, or 0, for non-real-time processes (see
                    sched_setscheduler(2)).

          (41) policy  %u  (since Linux 2.5.19)
                    Scheduling policy (see sched_setscheduler(2)).
                    Decode using the SCHED_* constants in linux/sched.h.

                    The format for this field was %lu before Linux
                    2.6.22.

          (42) delayacct_blkio_ticks  %llu  (since Linux 2.6.18)
                    Aggregated block I/O delays, measured in clock ticks
                    (centiseconds).

          (43) guest_time  %lu  (since Linux 2.6.24)
                    Guest time of the process (time spent running a vir‐
                    tual CPU for a guest operating system), measured in
                    clock ticks (divide by sysconf(_SC_CLK_TCK)).

          (44) cguest_time  %ld  (since Linux 2.6.24)
                    Guest time of the process's children, measured in
                    clock ticks (divide by sysconf(_SC_CLK_TCK)).

          (45) start_data  %lu  (since Linux 3.3)  [PT]
                    Address above which program initialized and unini‐
                    tialized (BSS) data are placed.

          (46) end_data  %lu  (since Linux 3.3)  [PT]
                    Address below which program initialized and unini‐
                    tialized (BSS) data are placed.

          (47) start_brk  %lu  (since Linux 3.3)  [PT]
                    Address above which program heap can be expanded
                    with brk(2).

          (48) arg_start  %lu  (since Linux 3.5)  [PT]
                    Address above which program command-line arguments
                    (argv) are placed.

          (49) arg_end  %lu  (since Linux 3.5)  [PT]
                    Address below program command-line arguments (argv)
                    are placed.

          (50) env_start  %lu  (since Linux 3.5)  [PT]
                    Address above which program environment is placed.

          (51) env_end  %lu  (since Linux 3.5)  [PT]
                    Address below which program environment is placed.

          (52) exit_code  %d  (since Linux 3.5)  [PT]
                    The thread's exit status in the form reported by
                    waitpid(2).
3. Summary
In this post, I demonstrated how to print thread status of a linux process using /proc/